Food Synergy Book
Free digital version with a paid InnerFood subscription. A 300+ page reference book. How to get optimal amounts of essential nutrients from clean whole food. However, the book provides so much more.


As we are offering a free copy of the digital FoodSynergy book with a paid subscription to InnerFood, it seems only appropriate to give some background information about this book and how it may benefit.
After completing a 4 year Nutrition Medicine degree at RMIT University in Melbourne, Australia, I started seeing clients in my clinic that was setup in Armidale with the help of my doctor friend in 2011. Food, nutrients and human health began to be explored in greater detail as clients wanted answers and help.
Data on food composition is readily available in most developed countries around the world including Australia, US and Europe. Using some data from Australia but mostly from the US, the FoodSynergy project was developed. This involved developing a database that contained 1000’s of readily available and common foods and the nutrients that each food contained. In 2015, after staring at foods, food groups and nutrients for a few years the FoodSynergy Book was born.
We will outline some of the contents in this book, how it can help and some other fun facts about food, food groups and lesser known but vital nutrients in this article.
The book contains 42 Food Synergy Profiles that cover 27 essential nutrients. The word “essential” simply means that the body cannot make these nutrients so we have to get them from food AND if just one nutrient is missing or even low in the diet, serious physical and cognitive things happen.
In its simplest form, these profiles give you an idea of which foods and food groups provide generous quantities of a particular nutrient. Each profile contains mostly whole foods that are rich sources of a key nutrient. Each of the important food groups are represented.
We often hear things like - Vitamin C is an essential anti-oxidant or those in rehab need extra vitamin B1 or omega-3 fats are beneficial for brain and immune function. And we are frequently told Magnesium is good for muscle relaxation. It could be that our doctor or health professional said: “get more zinc and fibre in your diet.” Or stay away from sugar (sucrose) foods.
These profiles quickly and easily direct you to lists of foods highest (and lowest) in a particular nutrient. Taking supplements should be an absolute last resort. After all, there is no multivitamin that has over 11,000 compounds that are available in a single leaf of spinach.
A lot of background work and planning has made this resource very easy to use while at the same time exceedingly useful. We have carefully worked out real-world serving sizes, so that resultant nutrient content more realistically reflects what we get from eating a meal. And choosing the most representative and commonly available foods around the globe has further simplified using this resource.
We also provide tables of RDIs (Recommended Daily/Dietary Intakes) for each Nutrient profile and for each age group, gender and pregnancy/lactation status. Iron and Zinc examples are shown below. We can quickly see that men have greater need for Zinc than woman while pregnant and reproductive age woman have significantly higher Iron needs. Importantly, and especially if you are supplementing, some nutrients have upper limits (shown in the last column) and exceeding these levels on a daily basis can lead to adverse reactions, some severe.
It’s often very revealing to look at these RDI’s for a few minutes, especially if you have a family. In another example, men over 70 years have the greatest requirement for protein of any age or gender group. By the way, older men in some aged-care villages are given shockingly low protein diets, and they end up eating a lot of cereal and toast, while their muscle mass declines and their skin continues to further droop. Not good.
The research on optimal nutrient intake has, in recent years, pointed to increasing previous RDI’s for some nutrients so as to take into consideration Chronic Disease Prevention (CDP). This is good. We have used these values, when available, as the RDI values here. Shown as “RDI for CDP” under the source column. Other RDI values are based on Estimated Average Requirements (EAR’s) or Adequate Intakes (AI’s). If interested, see https://www.nrv.gov.au/introduction for additional information on how these are derived, evidence and meaning.
Tables of RDIs - two examples from the book - Zinc and Iron


Whole Food & Nutrient Synergy profiles
It can be useful to consider whole food as a ‘delivery medium’ from nature that keeps us optimally tuned and vibrant. We might only know of a few nutrients within this medium at this point, but nature supplies so much more with each whole fresh morsel.

Common serving sizes are converted to grams so that calculated nutrient quantity is accurate as possible while at the same time informative for us food nerds, nutritionists, dieticians, mums & dads and chefs designing meals.
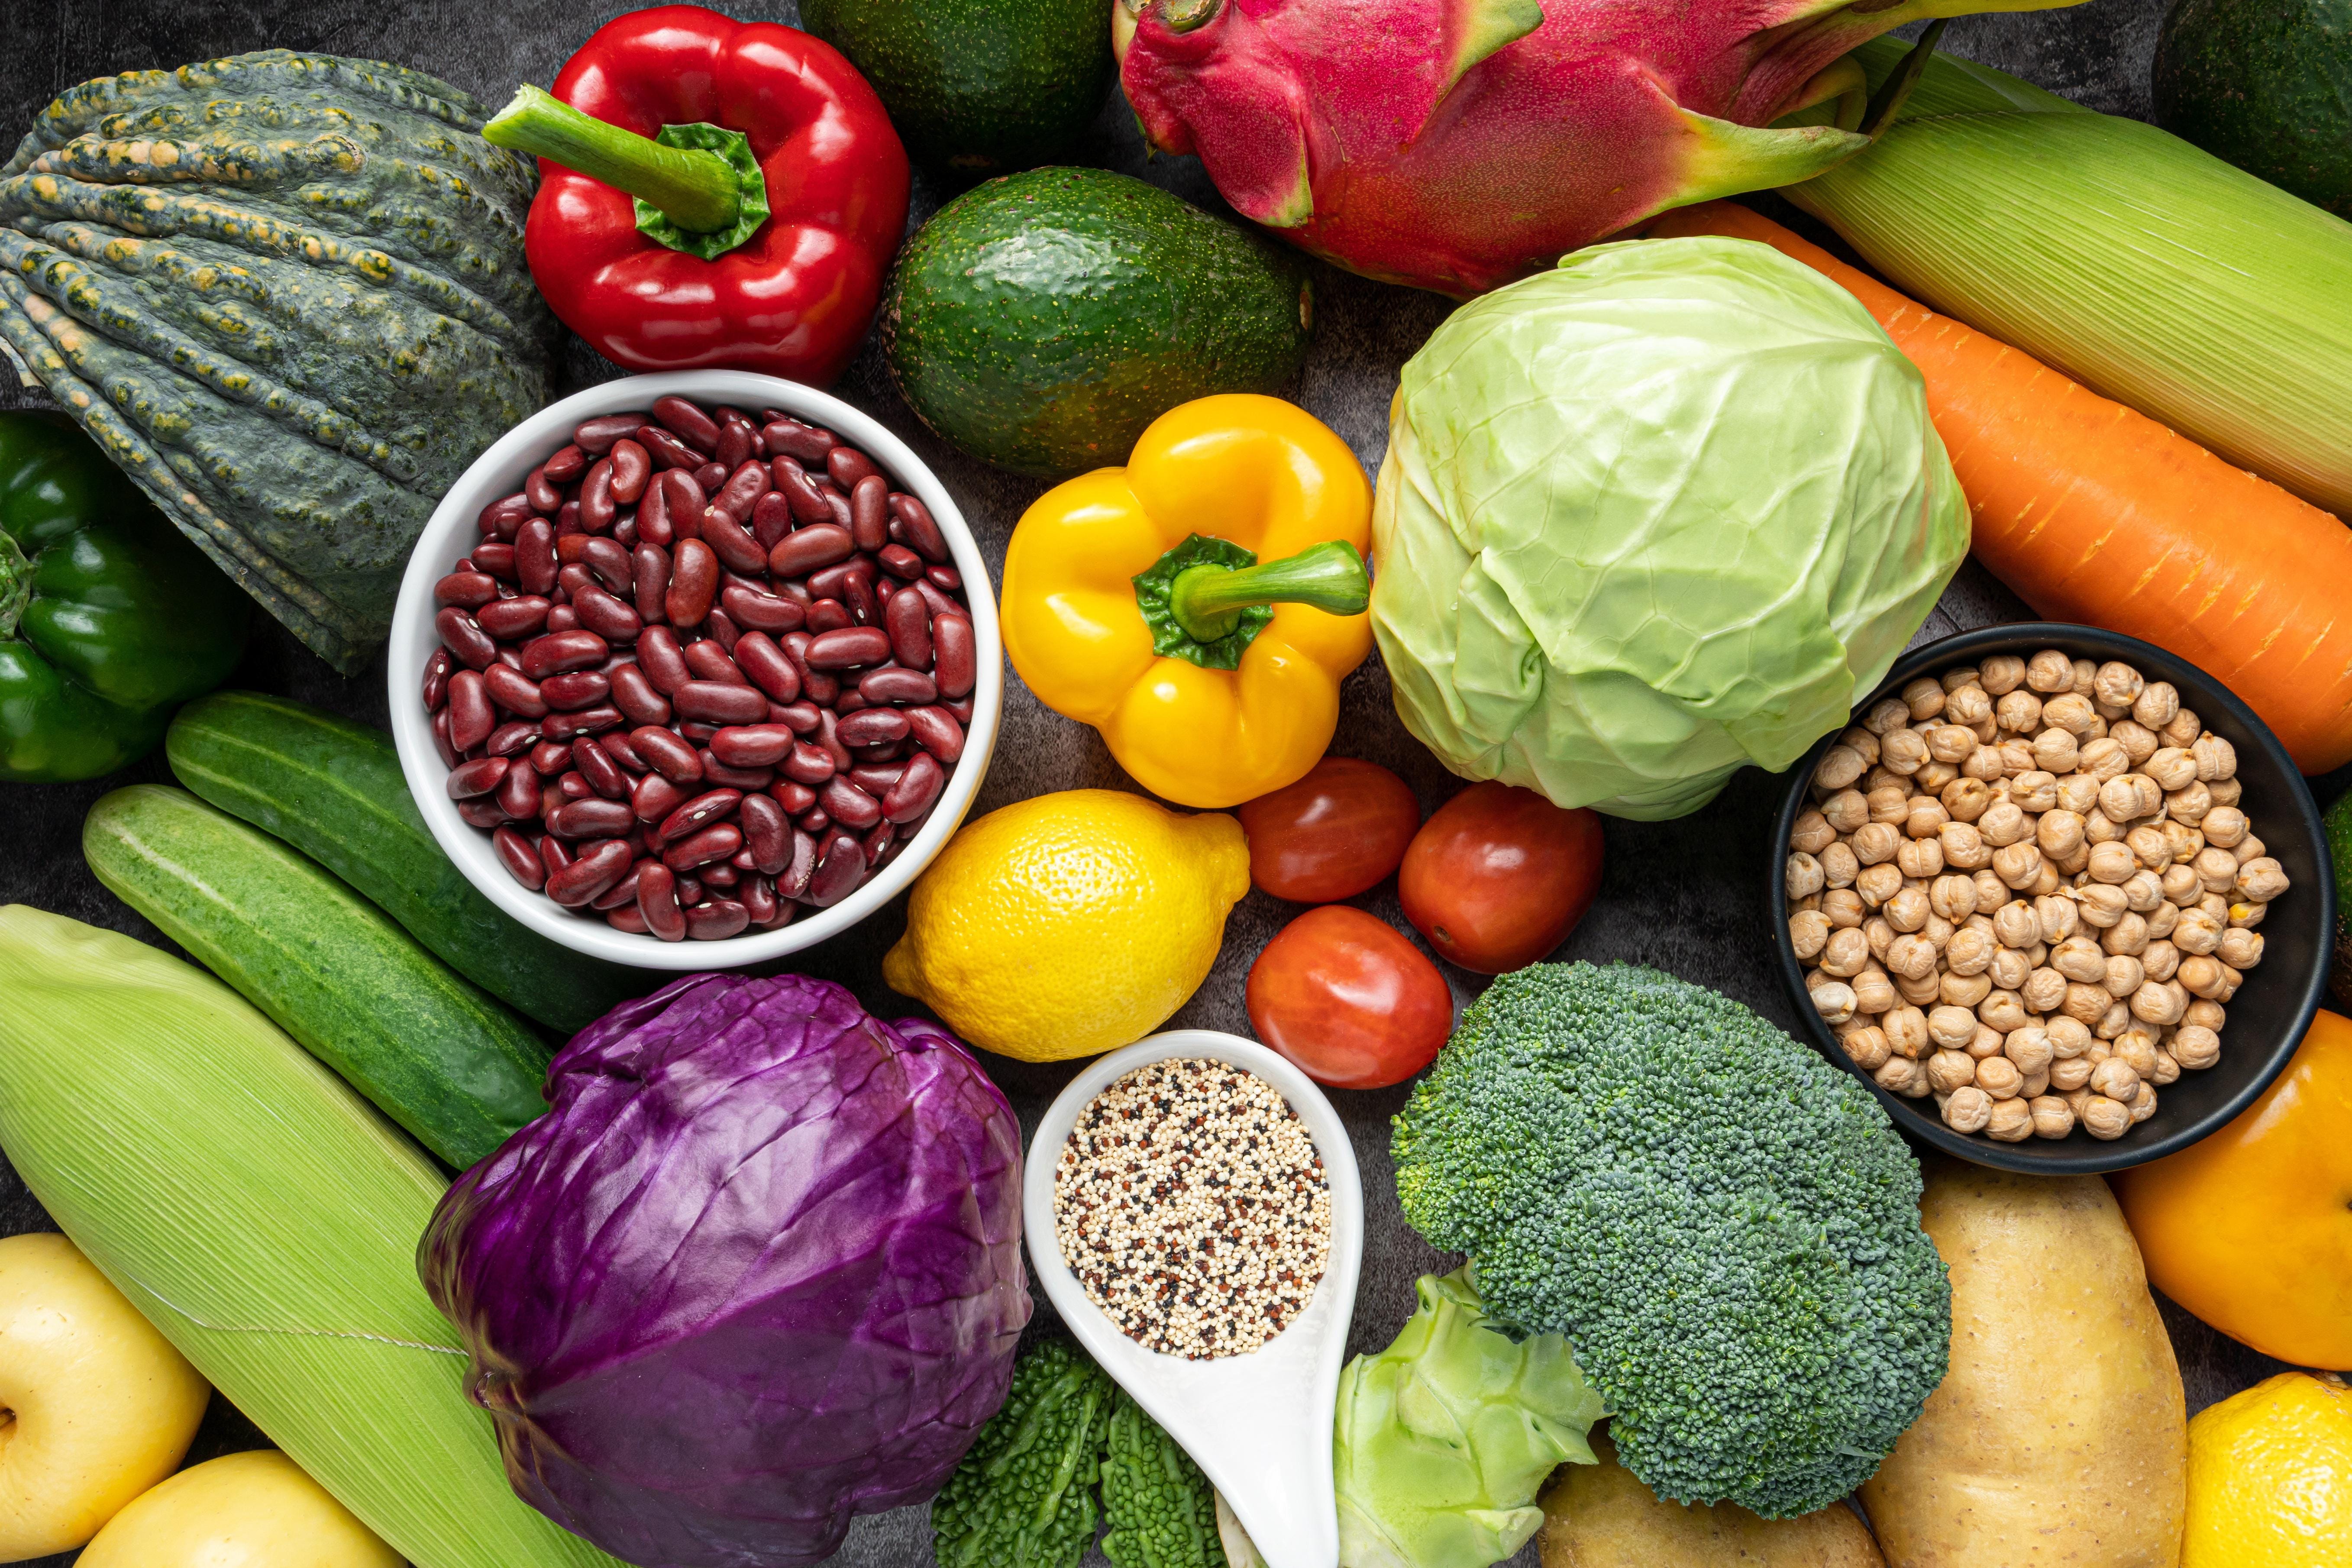
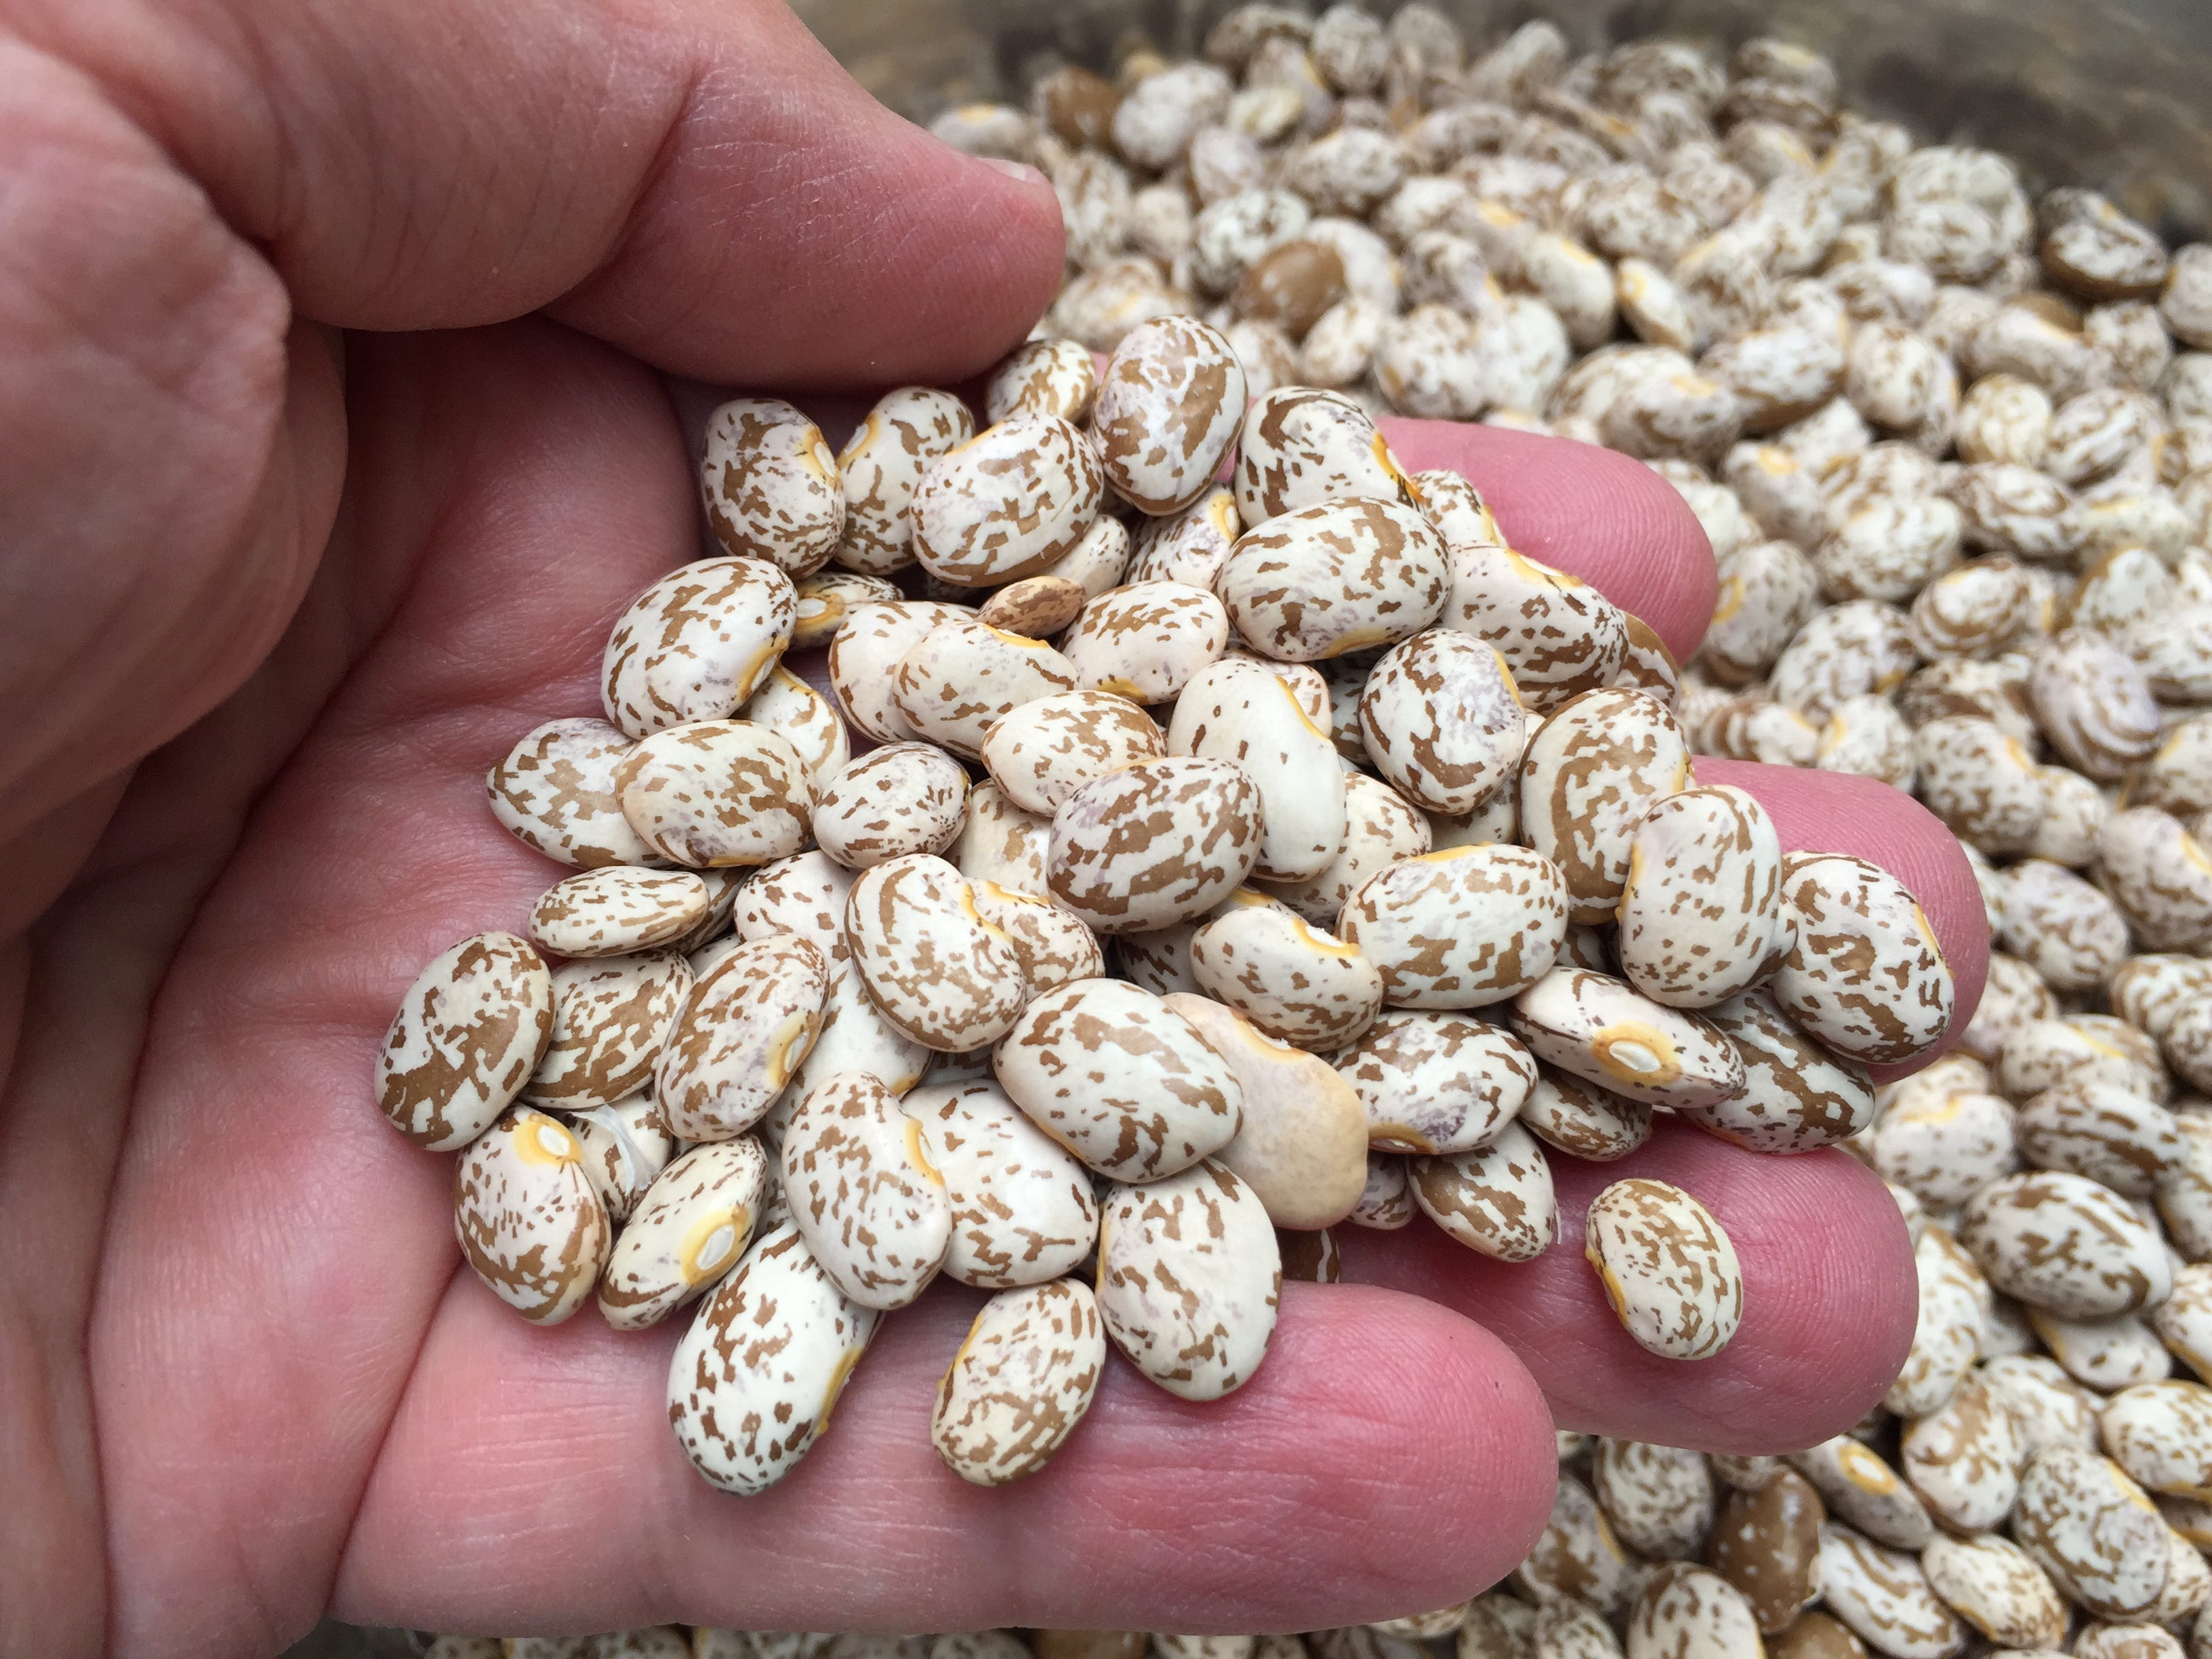
We cluster foods into groups like Non-Gluten Grains, Legumes, Meats, Nuts, Seeds, Dairy, Fruits etc. Evidence to date indicates that eating across food groups and maximising food diversity enhances nutrient sufficiency while providing a solid foundation for optimal health. This way you enhance the synergistic effect of various nutrients working together. Multiple nutrients are often required simultaneously in critical metabolic enzyme pathways in the body. Some can be stored in the body while others have short life spans. A daily diet needs to replenish many water soluble nutrients continuously.
Yet in addition to the 27 nutrients presented here, there are thousands of compounds in foods that we are only just beginning to explore. Many are showing powerful health-giving and even medicinal qualities.
We consider whole food as a ‘delivery medium’ from nature that keeps us optimally tuned and vibrant. We might only know of a few nutrients within this medium at this point, but nature supplies so much more with each whole fresh morsel. So when someone says “eat more vitamin C” you might think, “ yes, I’d like some Acerola cherries or a pummelo or maybe an organic apple with lunch”. In so doing you will flood your body with a swag of additional nutrient-substances that nature has prepackaged for you in an anti- oxidant rich skin.
Not all nutrients shown in this work have established RDI values. For these nutrients you won’t see any RDI data on the first page of the chapter. However the foods are still shown and they are sorted so that those foods with the greatest amount of the particular nutrient are shown first. Fructose and gamma-tocopherol (a form of Vitamin E ) are examples.
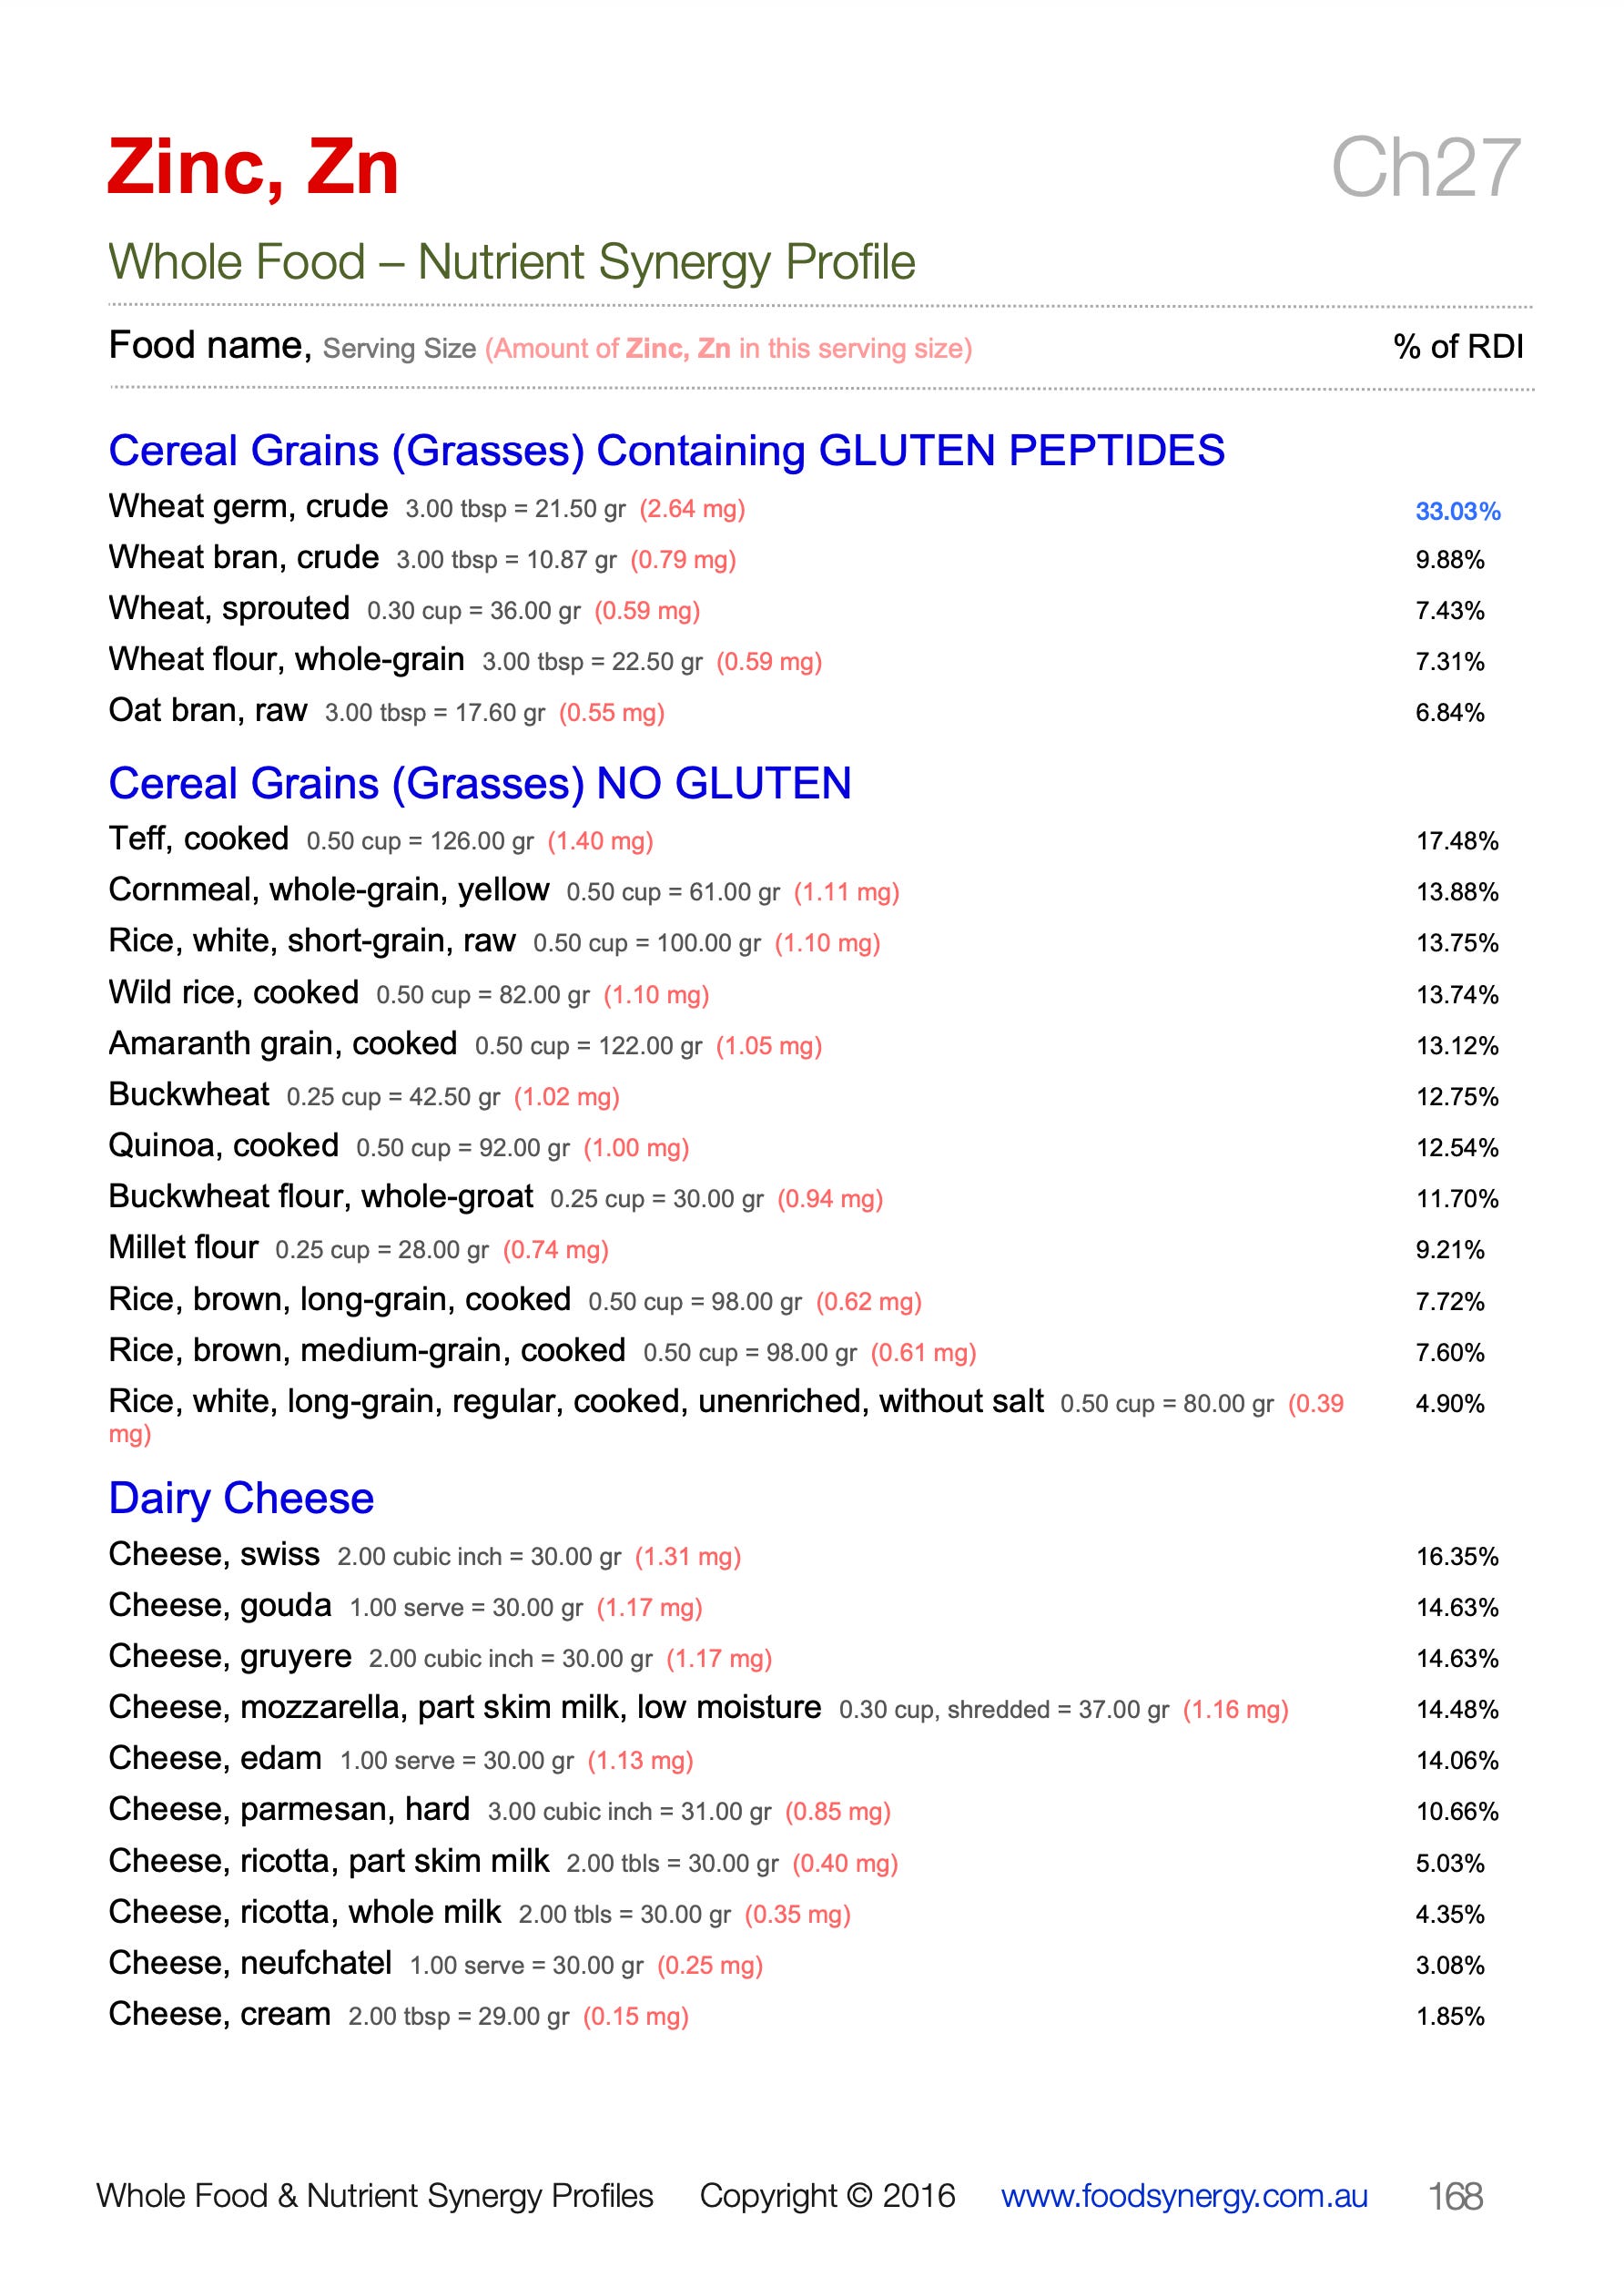
The second part of a profile contains the gist of the whole project. A list of foods is sorted from highest to lowest nutrient level within each separate food group. This is demonstrated by the column on the right labelled “% of RDI”. The higher this value, the more nutrient is contained within that particular food item. Values above 20% are shown in blue so that these foods stand out. Importantly, these “% of RDI” values are based on real world serving sizes, not just 100grams of the food.
Some examples of Zinc…


Nutrients in the Book
Ascorbic acid - Vitamin C
Cobalamin - Vitamin B12
Folate, Dietary Equivalents
Lycopene
Niacin - Vitamin B3
Pantothenic acid - Vitamin B5
Pyridoxine - Vitamin B6
Riboflavin - Vitamin B2
Thiamin - Vitamin B1
Vitamin A
Vitamin D
Vitamin E (alpha-tocopherol)
Vitamin E (gamma-tocopherol)
Vitamin K1 (phylloquinone)
Vitamin K2 (Menaquinone-4)
Phytosterols
Calcium, Ca
Copper, Cu
Fluoride, F
Iron, Fe
Magnesium, Mg
Manganese, Mn
Phosphorus, P
Potassium, K
Selenium (soil dependent)
Sodium, Na
Zinc, Zn
TOTAL CARBOHYDRATE
TOTAL ENERGY in KCal
TOTAL ENERGY in Kj
TOTAL FAT - GRAND Total
TOTAL FIBRE
TOTAL PROTEIN
TOTAL SATURATED FATS
TOTAL SUGARS
DHA | Omega 3
EPA | Omega 3
TOTAL Linoleic Acid | Ω6
TOTAL Linolenic Acid | Ω3
Fructose
Starch
Sucrose
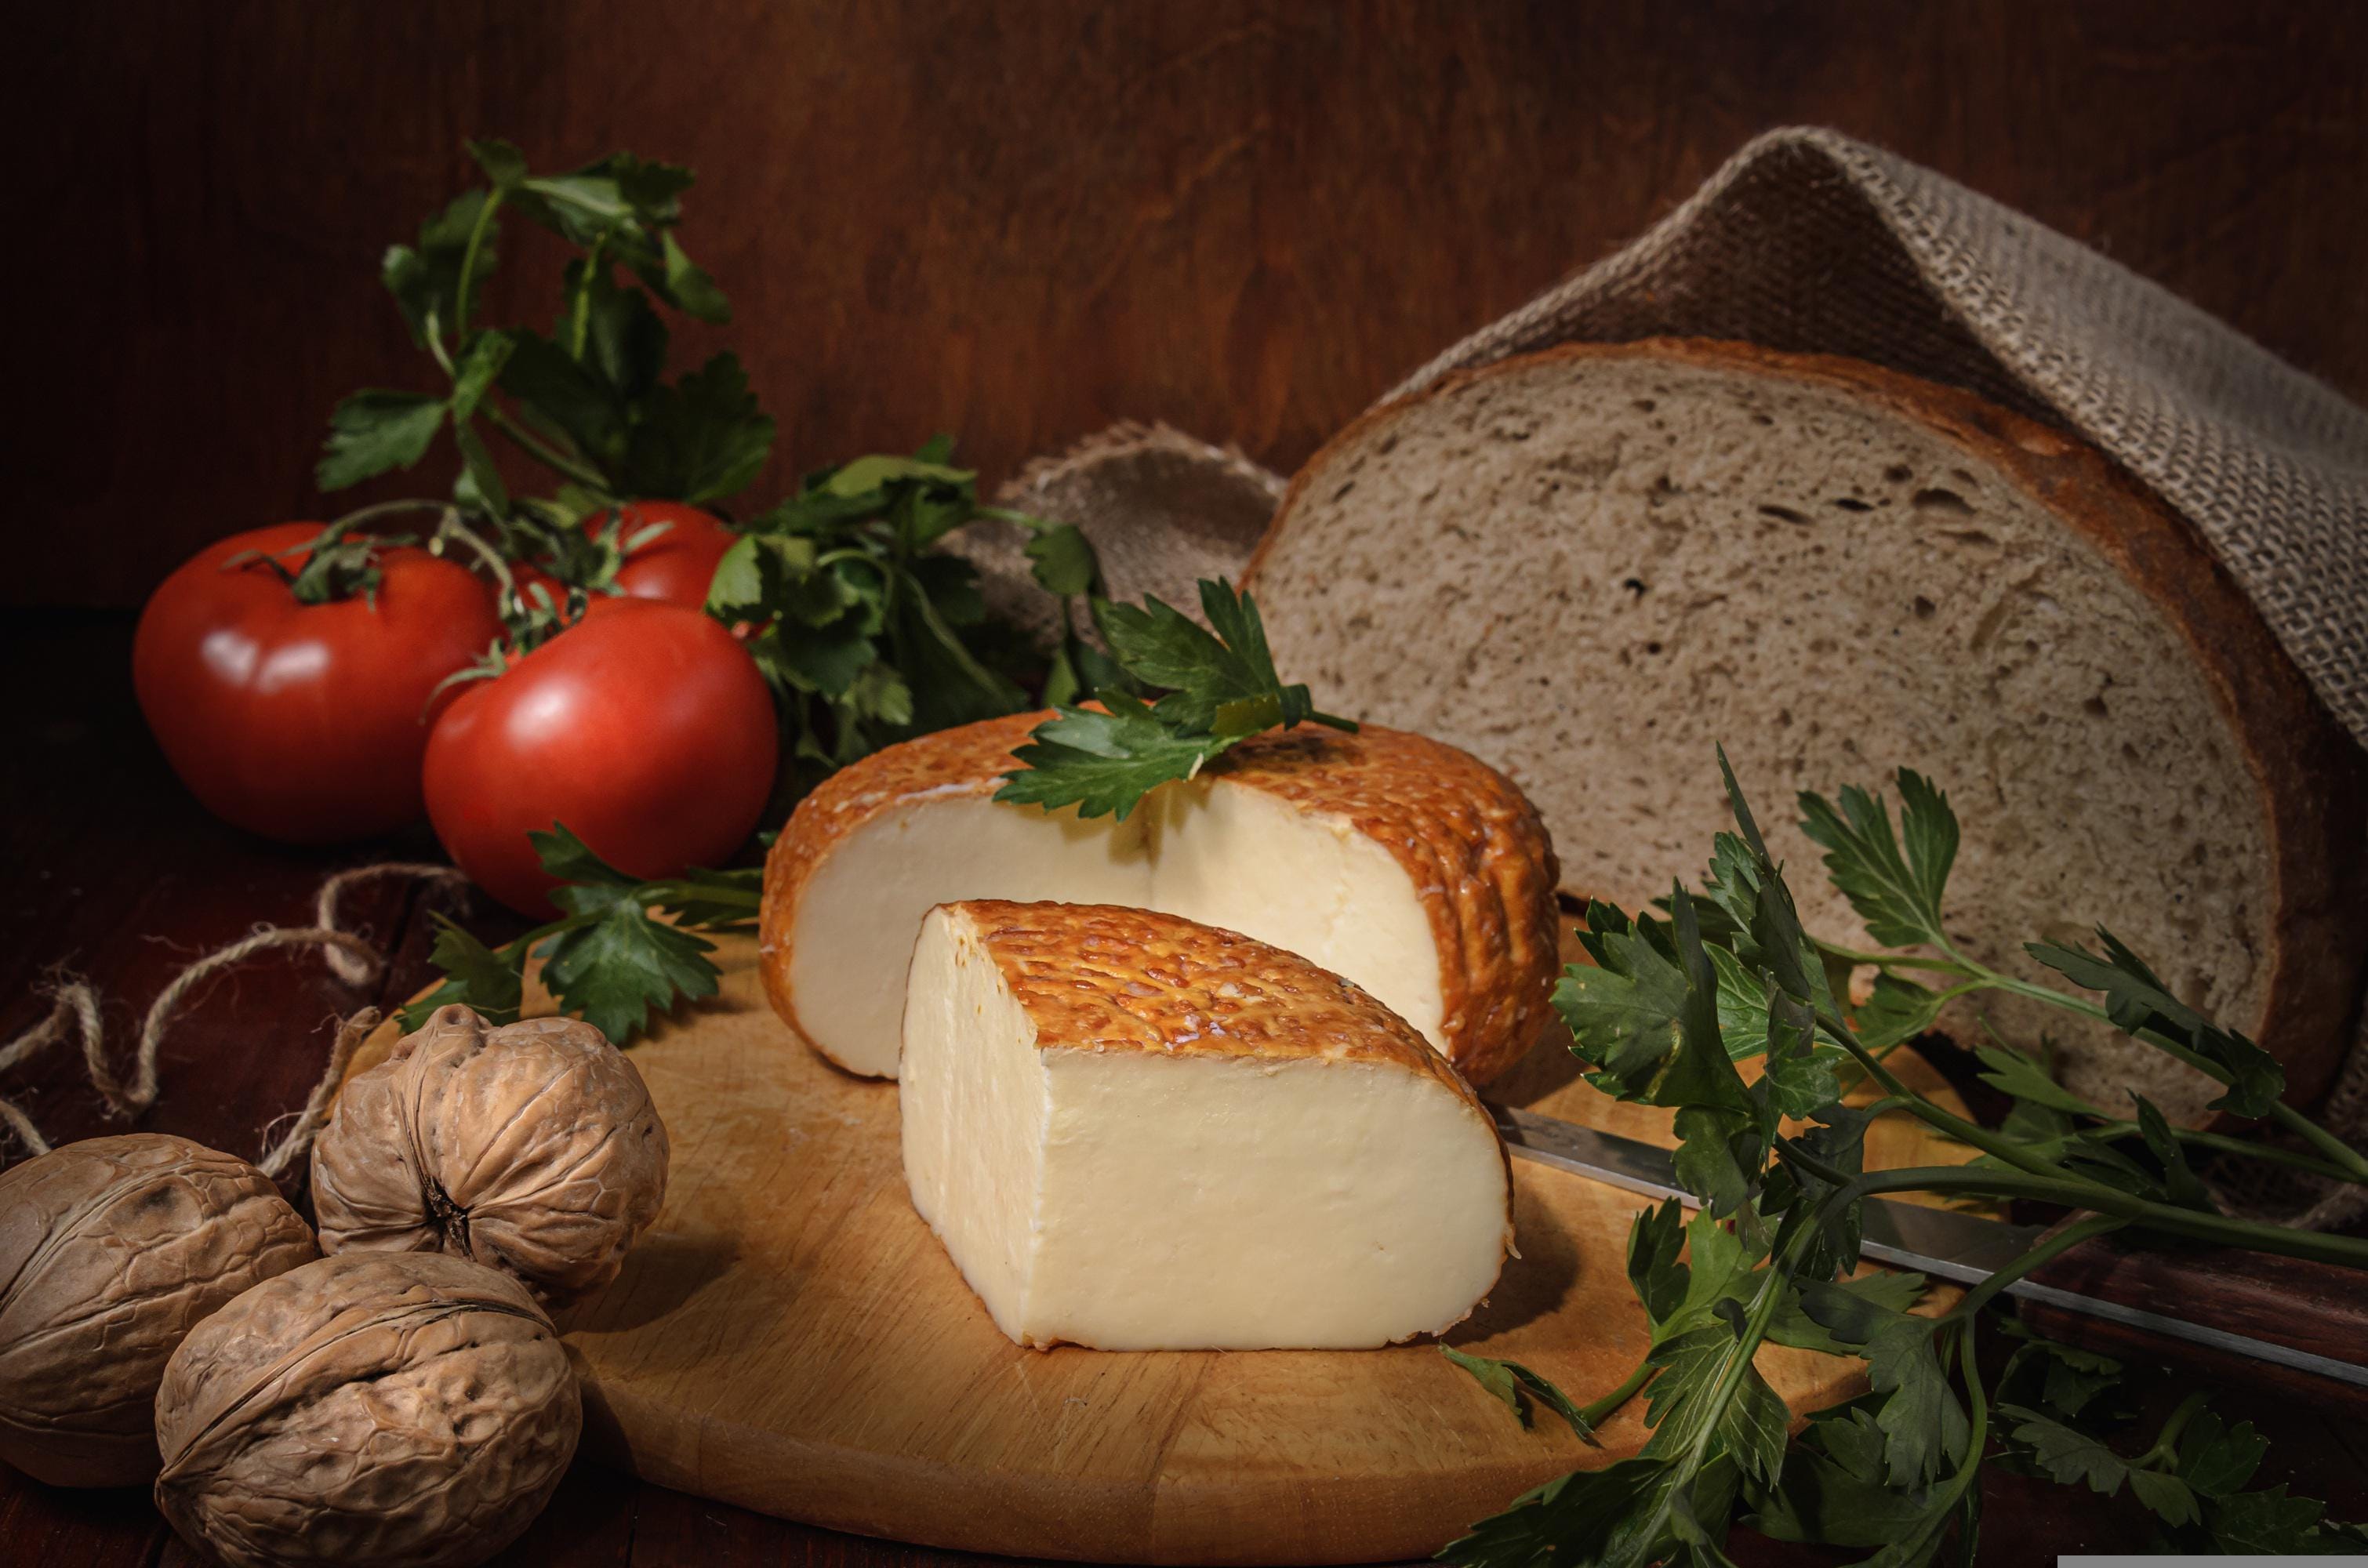
The foods shown are mostly whole foods. We define whole foods as those that have had minimal processing, storage, travel and modification. This is similar to the essence of the Mediterranean Diet. We will be writing more about the great health benefits of this style of eating in future articles.
We have also included a few foods that are very low in the particular nutrient. This is to give an idea of comparison and help in overall learning and understanding about foods. On occasion we show processed foods or fast foods for a particular nutrient profile, not to encourage their eating, but rather to draw attention to the magnitude of the scale of difference between foods.
Maximum effort is made to ensure the integrity and accuracy of the data used in this work. This information is provided so that we can learn, ask questions and understand more about food, nutrients and health.
This work or the USDA, NHMRC, Food Standards Australia New Zealand, Food Synergy or founder Hartmut Günther makes no attempt to diagnose or cure anybody. Daily nutrient requirements for an individual may differ from the RDI’s indicated. This is especially the case in advanced chronic illness, compromised digestive capacity, genetic conditions, medication, athletic training or muscle building. Consult a health professional if in doubt.
Nutrient values in foods you eat can vary from those shown here. Factors that influence food nutrient content include - the length of time on the shelf, cultivar of the food, soil quality including its nutrient and microbial status, country of origin, travel and amount of processing. Obviously not all foods on planet earth are shown. In this edition we have targeted commonly available whole foods now available in many countries around the world. Processed foods can be fortified with synthetic nutrients, and on occasion these are shown because many families rely on them (Australian children’s foods like Wheatbix is an example).
The emphasis of this work is on how to get great nutrition predominantly from whole foods. The “% of RDI” values shown in the lists of foods are based on the needs of a healthy woman of child bearing age. These “% of RDI” values are used as a marker to demonstrate which foods are richest in a certain nutrient. Clearly, in spite of these factors the main gist of this work strongly prevails - a visual representation of which whole foods and food groups are rich sources of a particular essential nutrient.